I launched Product Chart in January 2015. But I have been dabbling with the idea to put products on charts since end of March 2014. So the technology is a year in the making now.
Here is how Time on Site and Bounce Rate developed during the past 12 months as I tweaked the site according to user feedback:
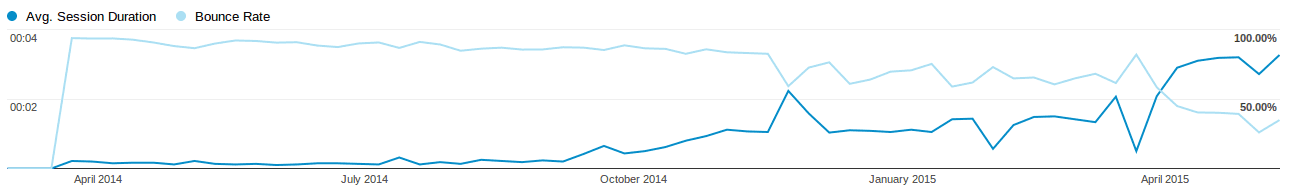
Bounce rate went from 100% (at first it was a single page with nothing to do) to below 50%. Average time on the site went from almost nothing to over 3 minutes. This also contains the bounced sessions. People who actually use the site, use it for over 5 minutes on average now.
Here is a version annotated with some of the major updates: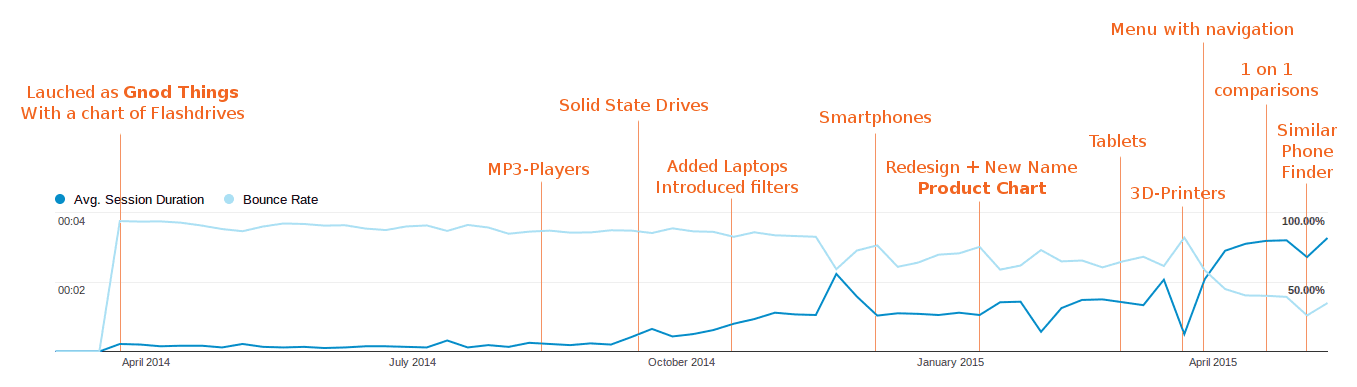
I see two forces at play here. For one, the site gets more useful. And additionally it finds it's audience. At first most people probably checked it out to see this new type of technology in action. Over time more people visit who actually want to compare products.